EURUSD Forex
-
Search Results
We couldn't find any match result
Search Results
We couldn't find any match result
Search Results
We couldn't find any match result
Search Results
We couldn't find any match result
Search Results
We couldn't find any match result
Search Results
We couldn't find any match result
Services User Guide
- Home
- User guide
ChartDepth is a financial markets signals service that uses artificial intelligence to scan the markets and provide traders with all the information they need to make informed trading decisions. The service offers a variety of features.
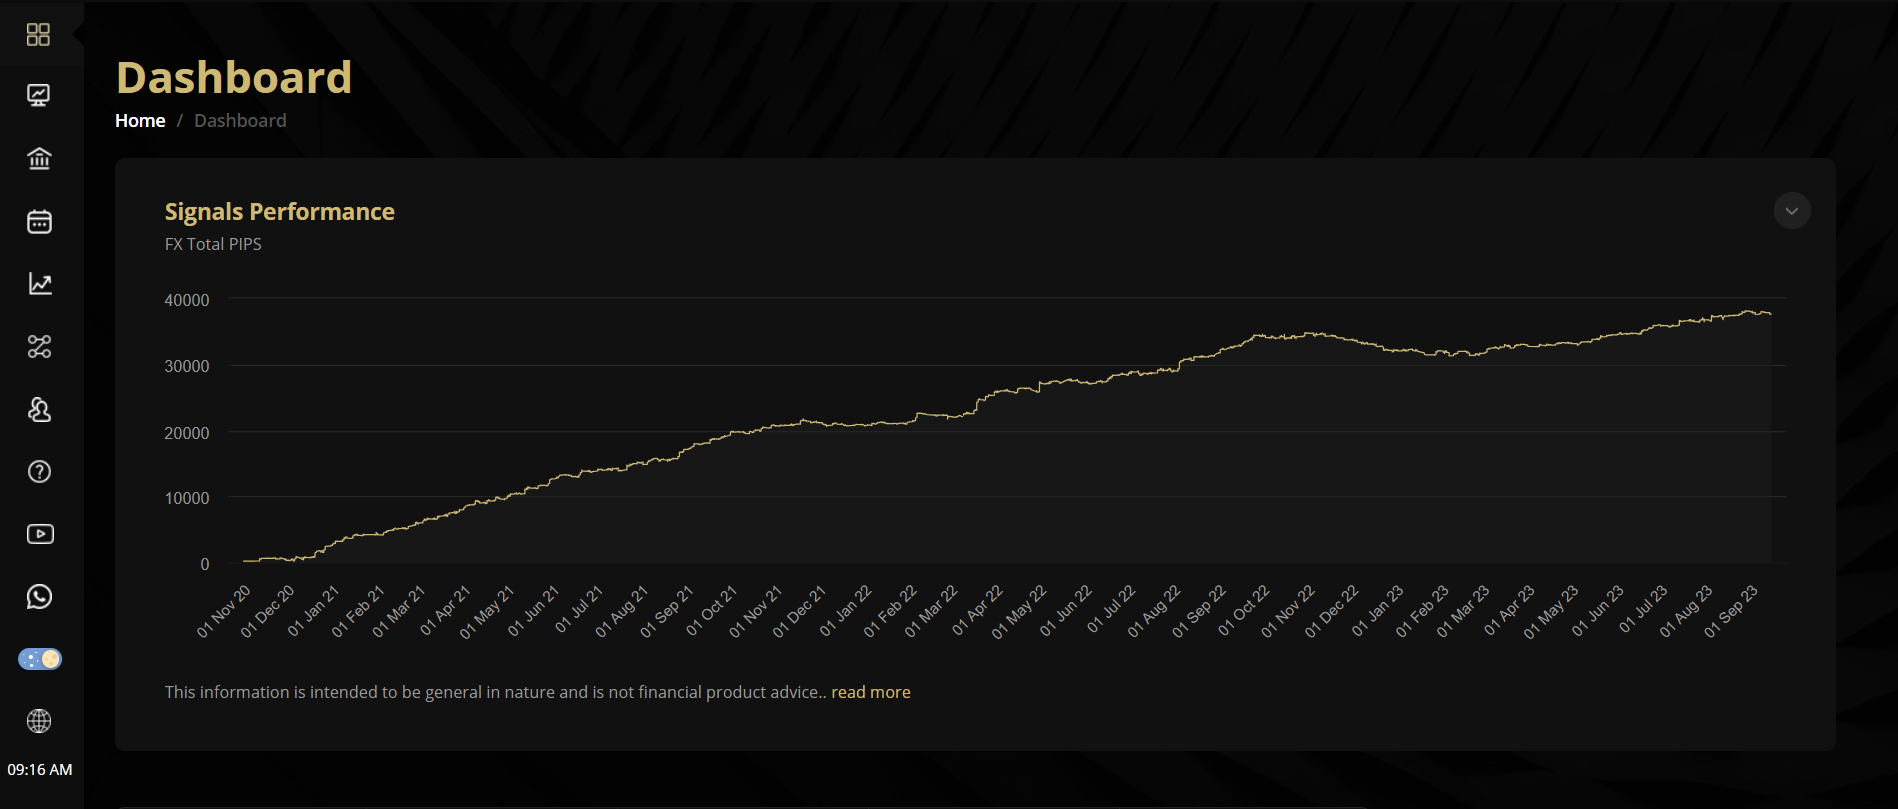
In the dashboard page you can check ChartDepth Signals performance.
Advanced Charting Tools
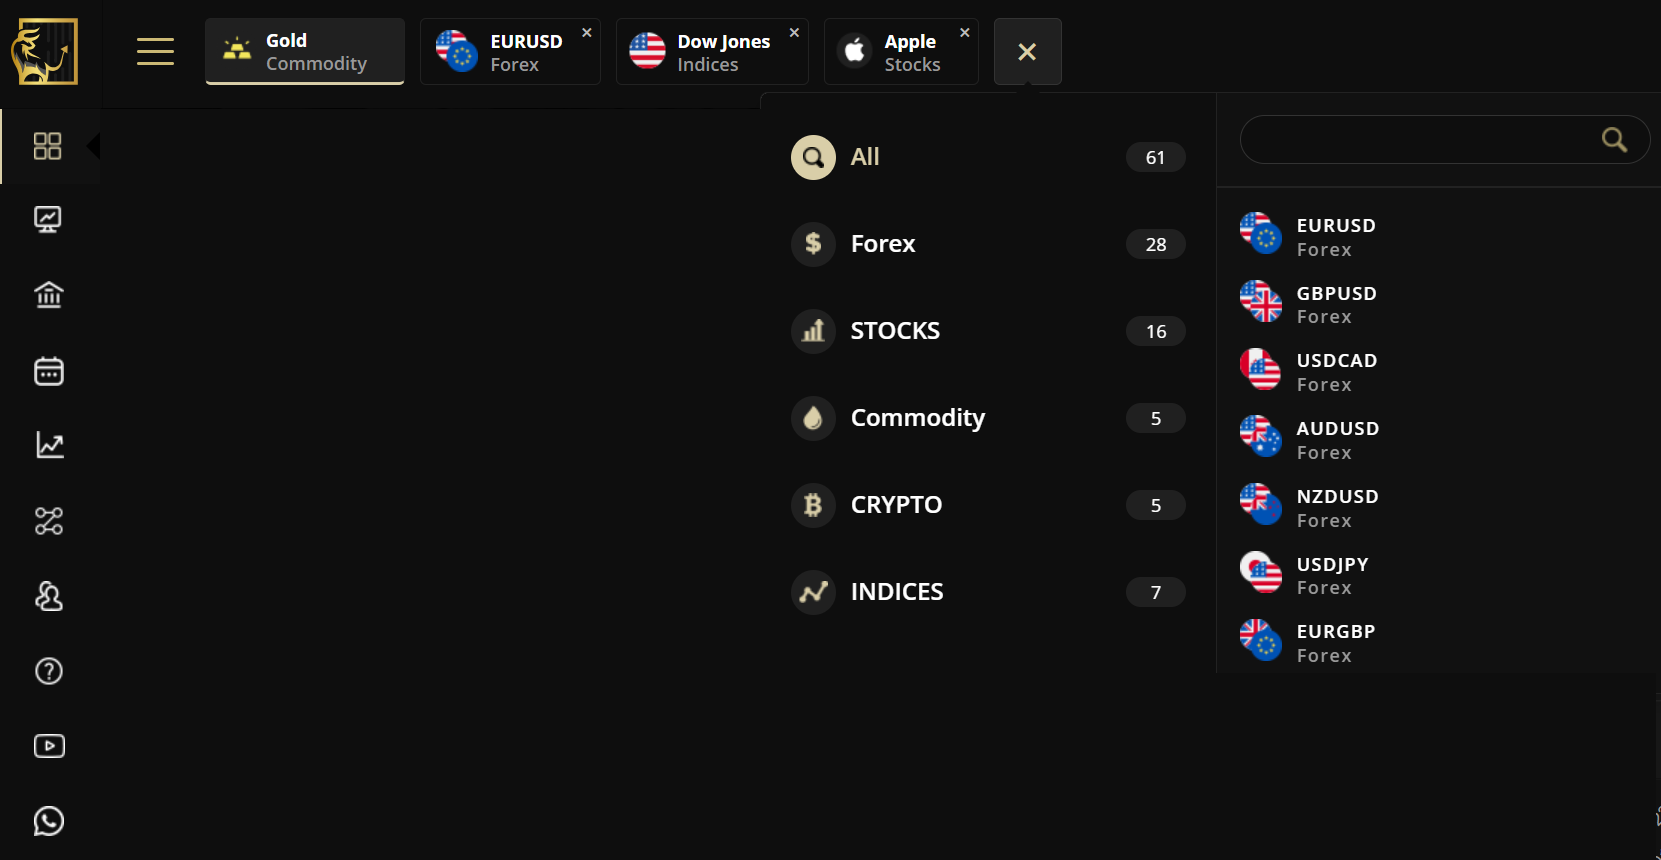
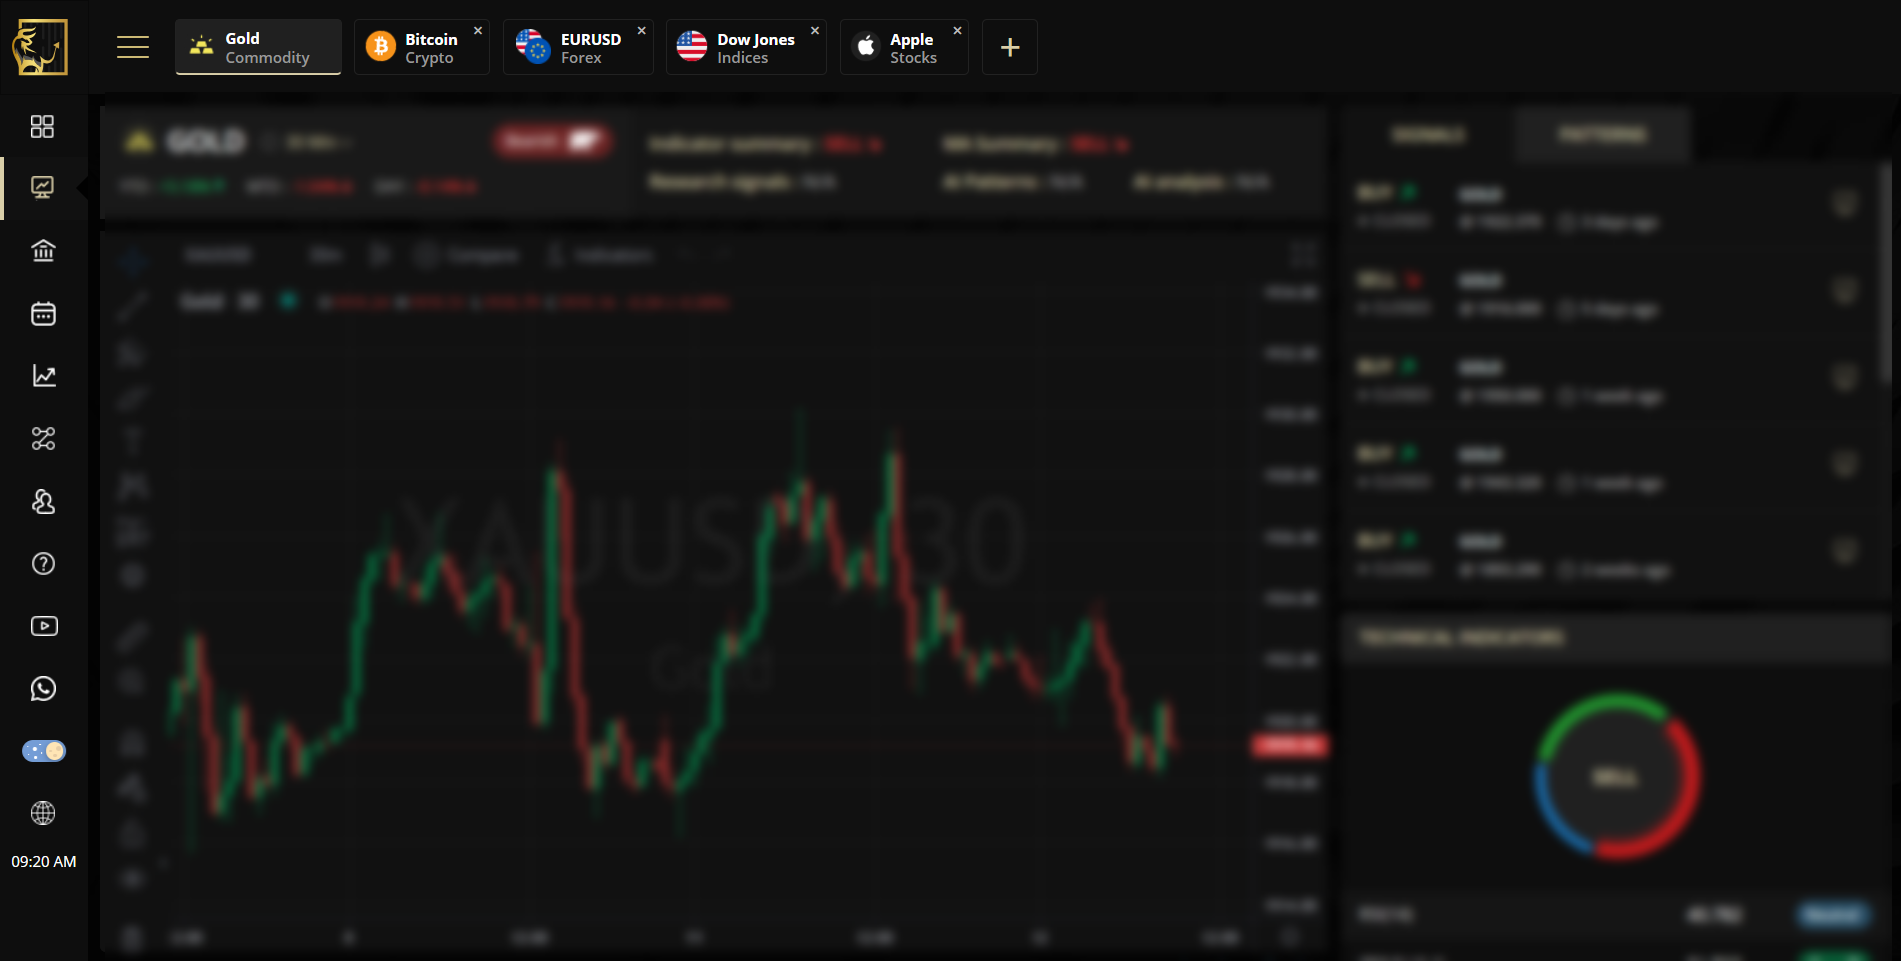
You can also open the advanced charting tools for your preferred trading tools from the tabs at the top of the page.
Trading Tools
You can choose between Currencies, Stocks, Commodity, Crypto and indices.
In the same page you can have an overview of available signals and patterns for trading tools at the bottom of the page.
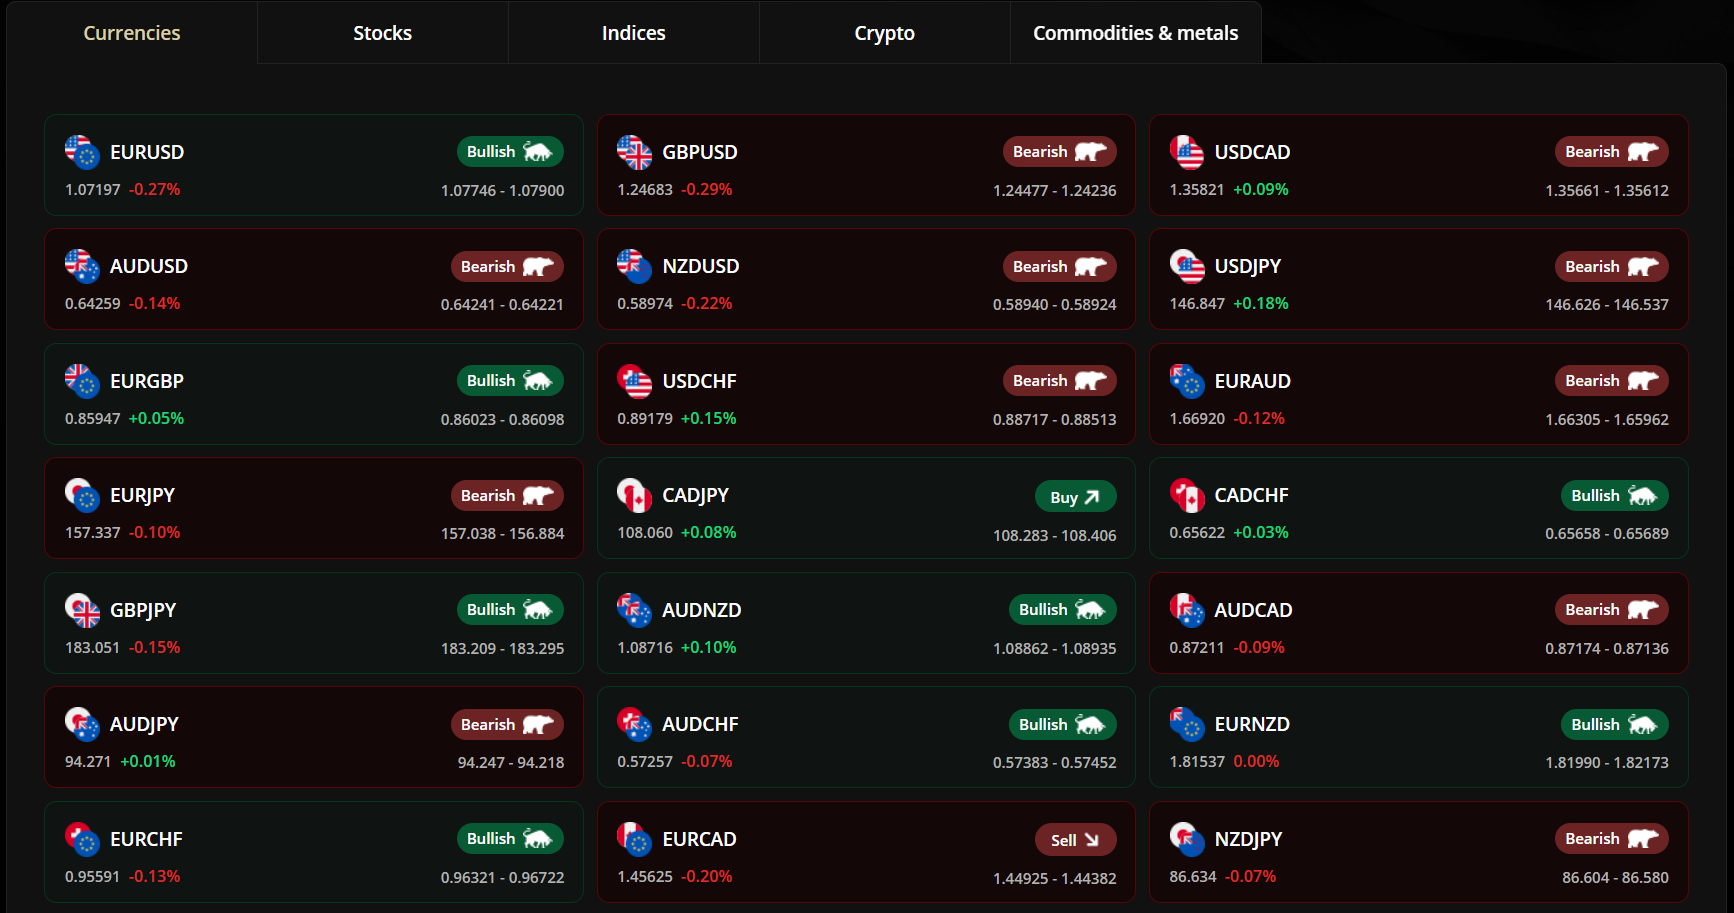
If there is a recent signal for a trading tool it will appear in (Buy or Sell) icon, you can check the signal if you clicked on the (Buy or Sell) icon.
If there is a recent pattern you will see (Bullish or Bearish) Icon and this icon refers to the available pattern whether it is a price action or harmonic pattern.

SIgnals
If you clicked the signal (Example: Buy GBPNZD) you will be directed to the signal as shown below.
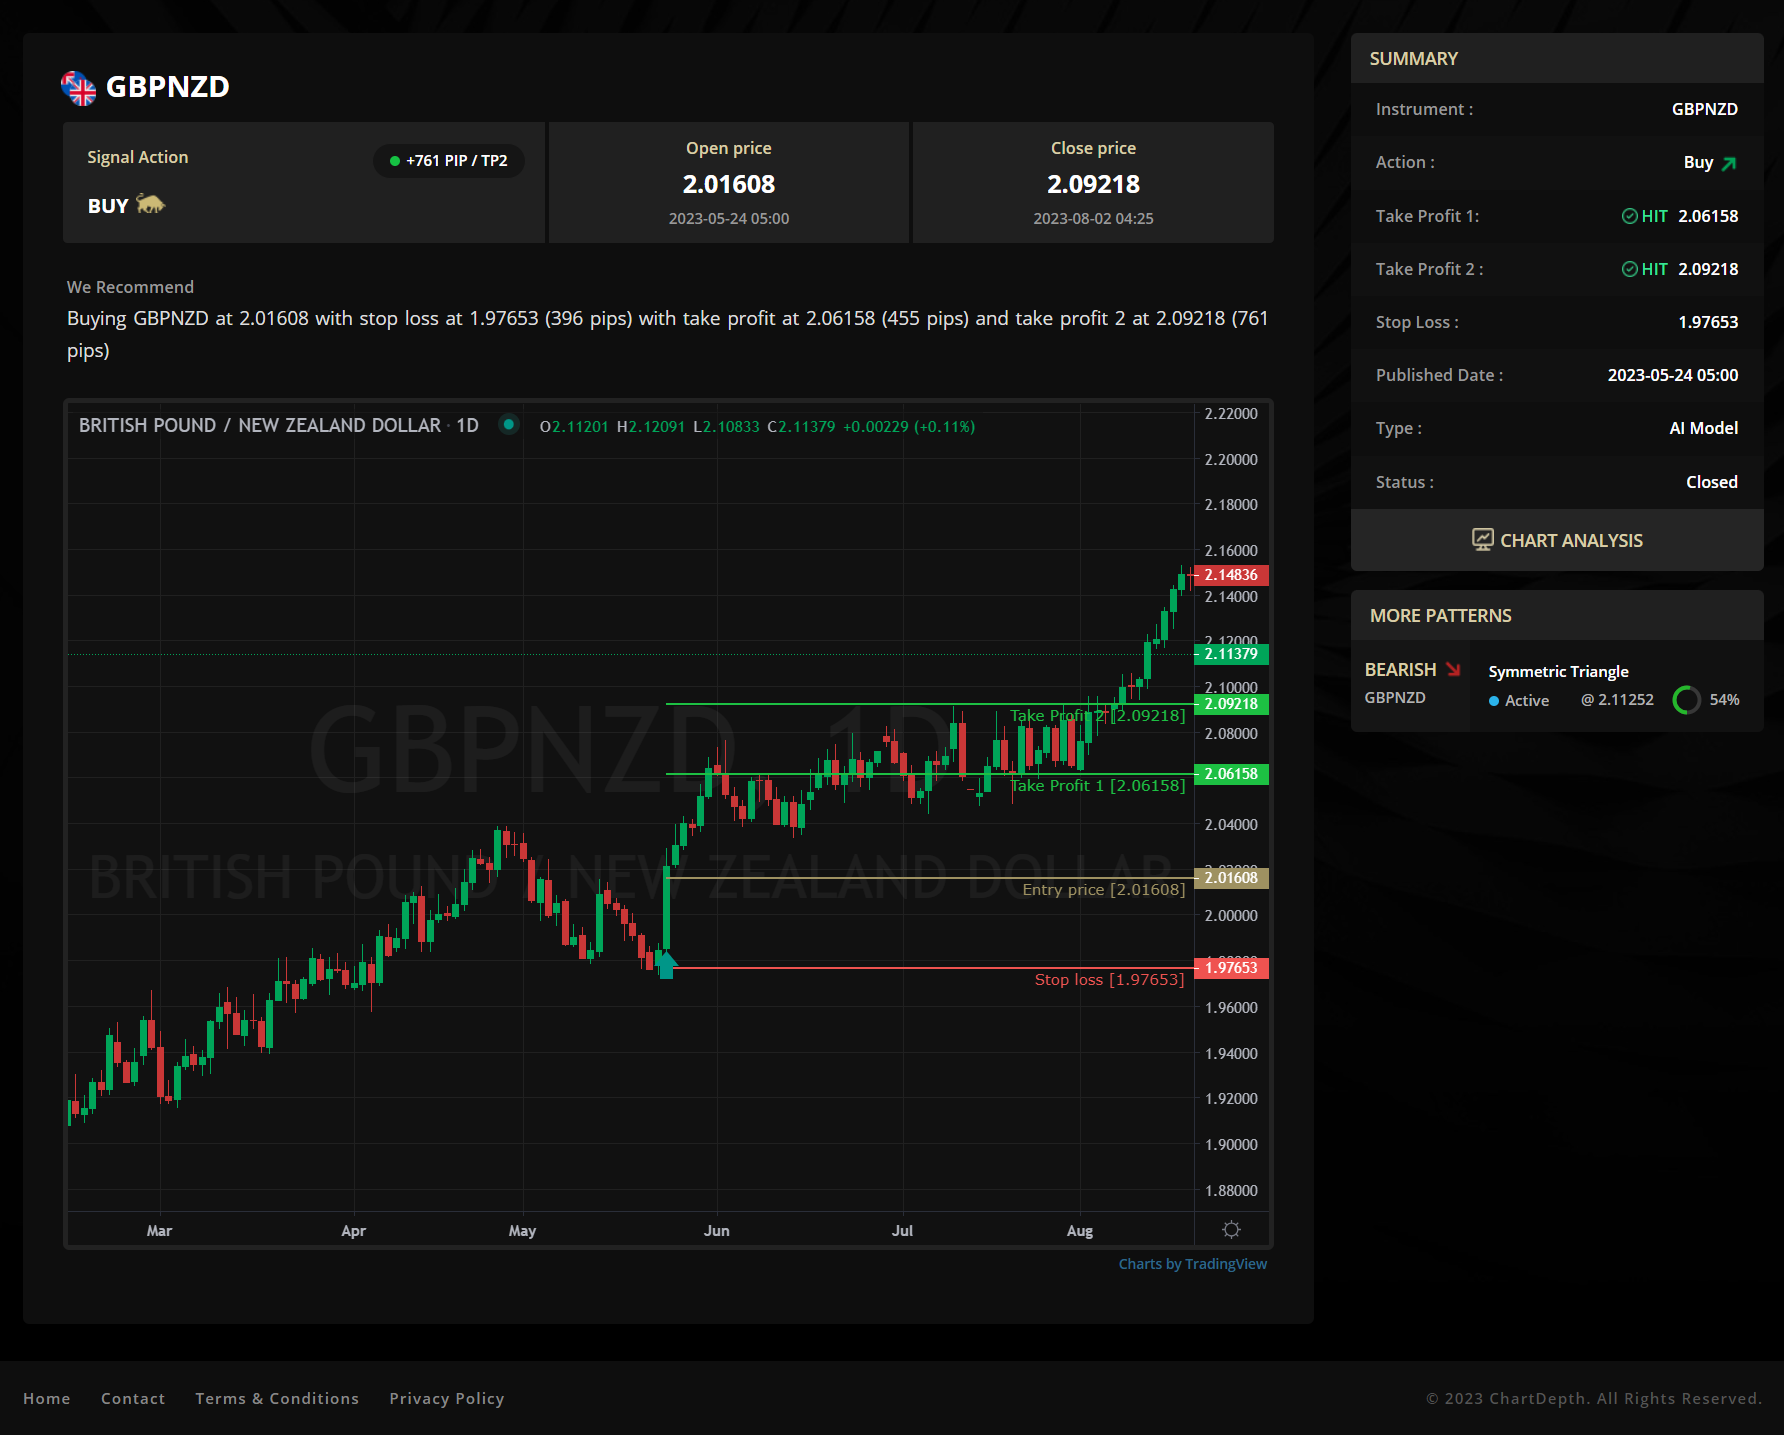
Signal Details
In this page you will get more detailed information about the signal like Entry level, Stop level and targeted levels and other more details like stop loss and target levels pips.
Patterns
At the bottom of the page, you will find a technical commentary for the trading tool and support and resistance levels.
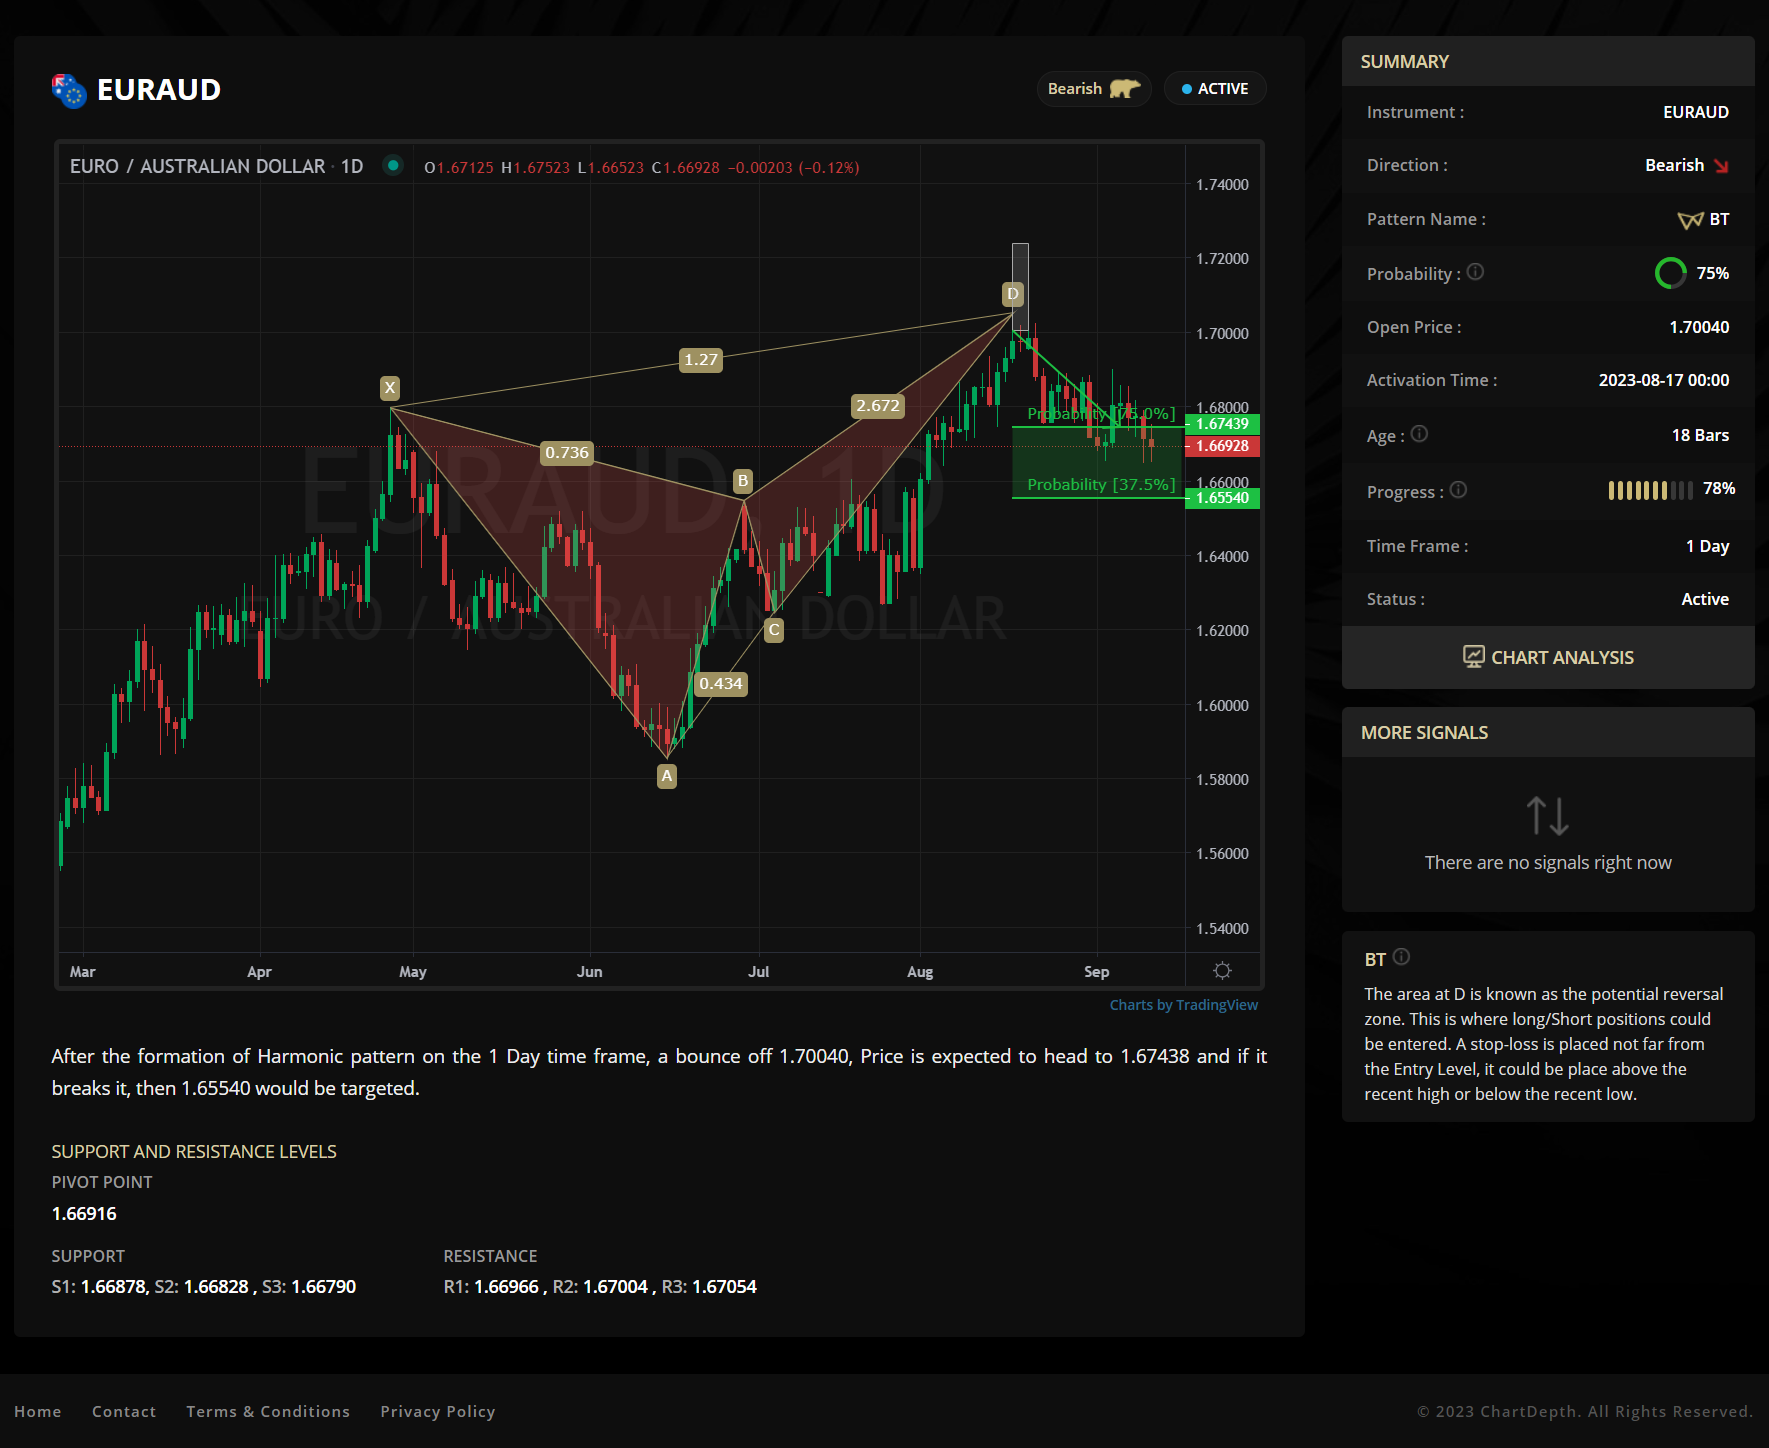
If you clicked the (Bullish or Bearish) icon you will be redirected to the available pattern for the trading tool (Example: Bearish EURAUD)
In this page you will find more details about the expected trend of the trading tools, like the name of the pattern, the accuracy of the pattern which means the success percentage and the time frame of the pattern and more!
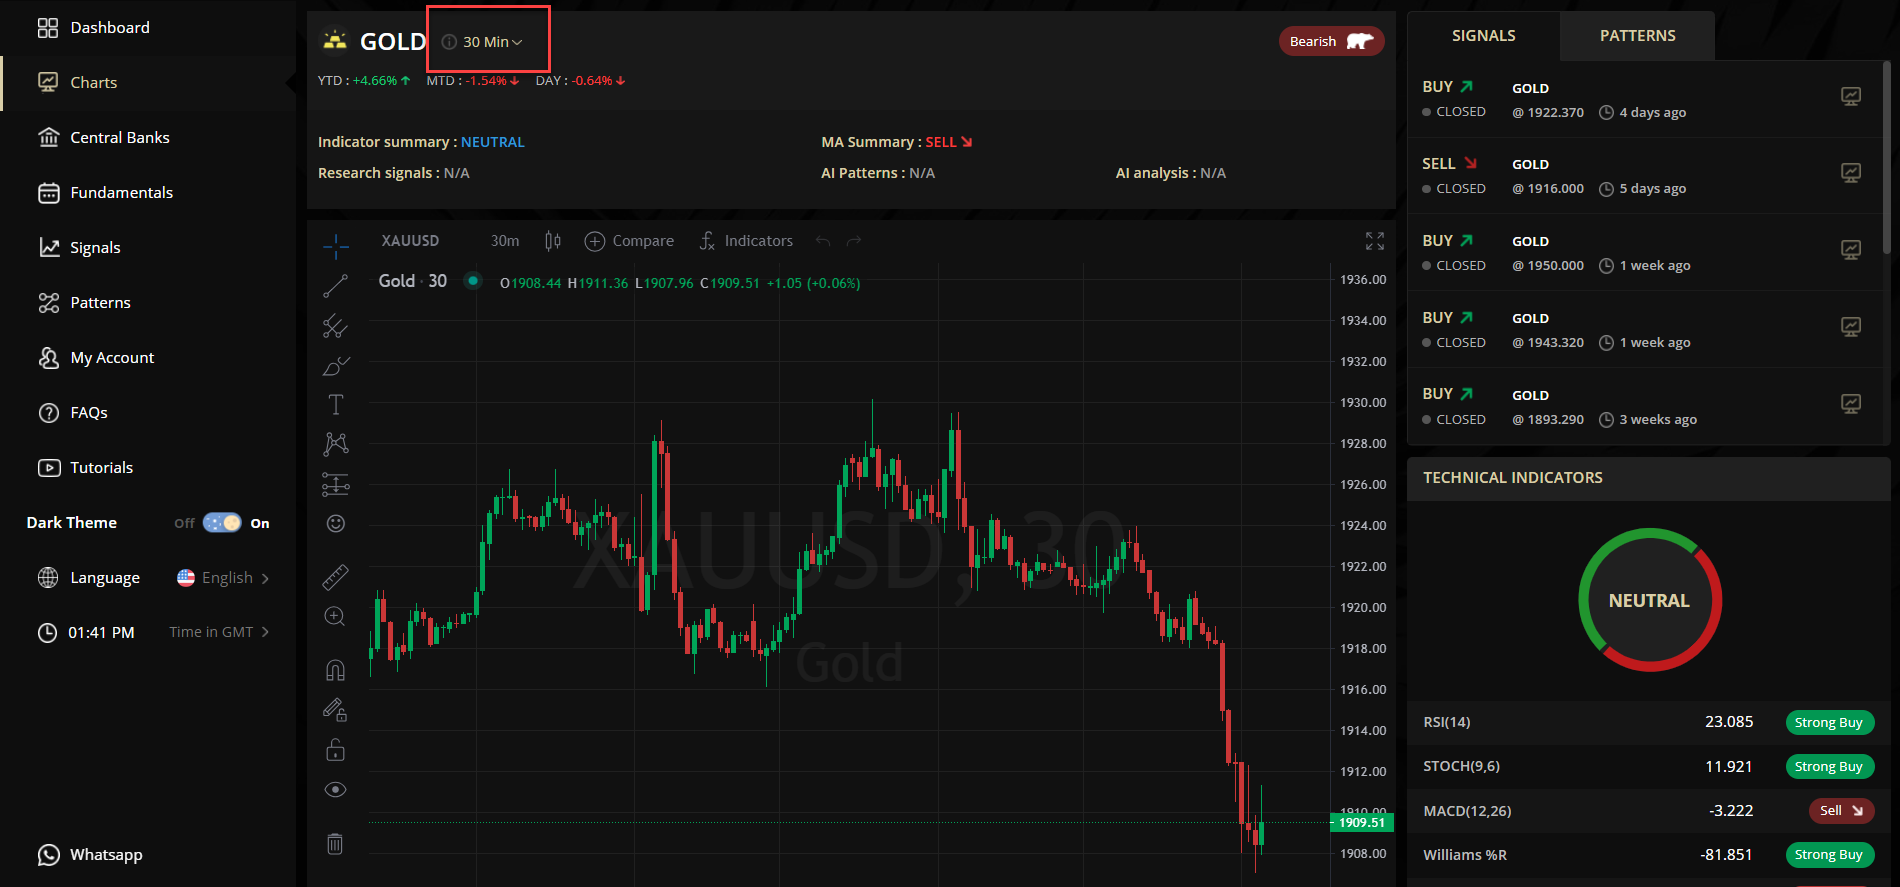
In the chart page you will find an overview for the available signals and patterns for the chosen trading tools.
You will find a technical indicators summary above the chart.
Signals and patterns on the right side of the chart.
Technical indicators bias at the right side of the chart.
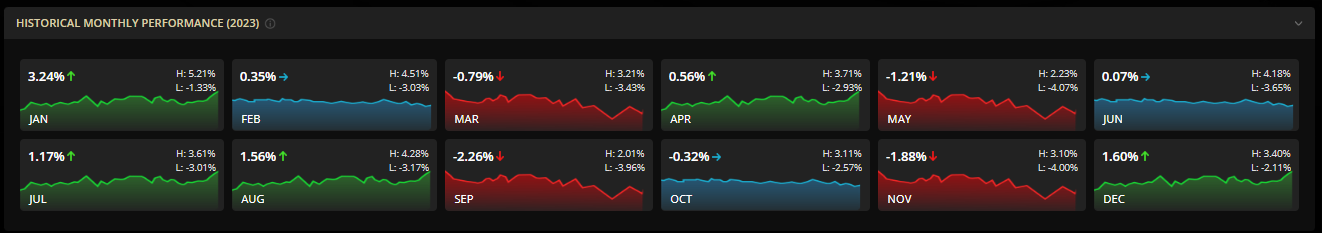
Historical performance below the chart which will show you the expected performance of the trading tool for each month for the whole year depending on the last 10 years performance.
Also, you can check support and resistance levels at the bottom of the page.
Please note that summaries and available patterns change according to the time frame you pick.
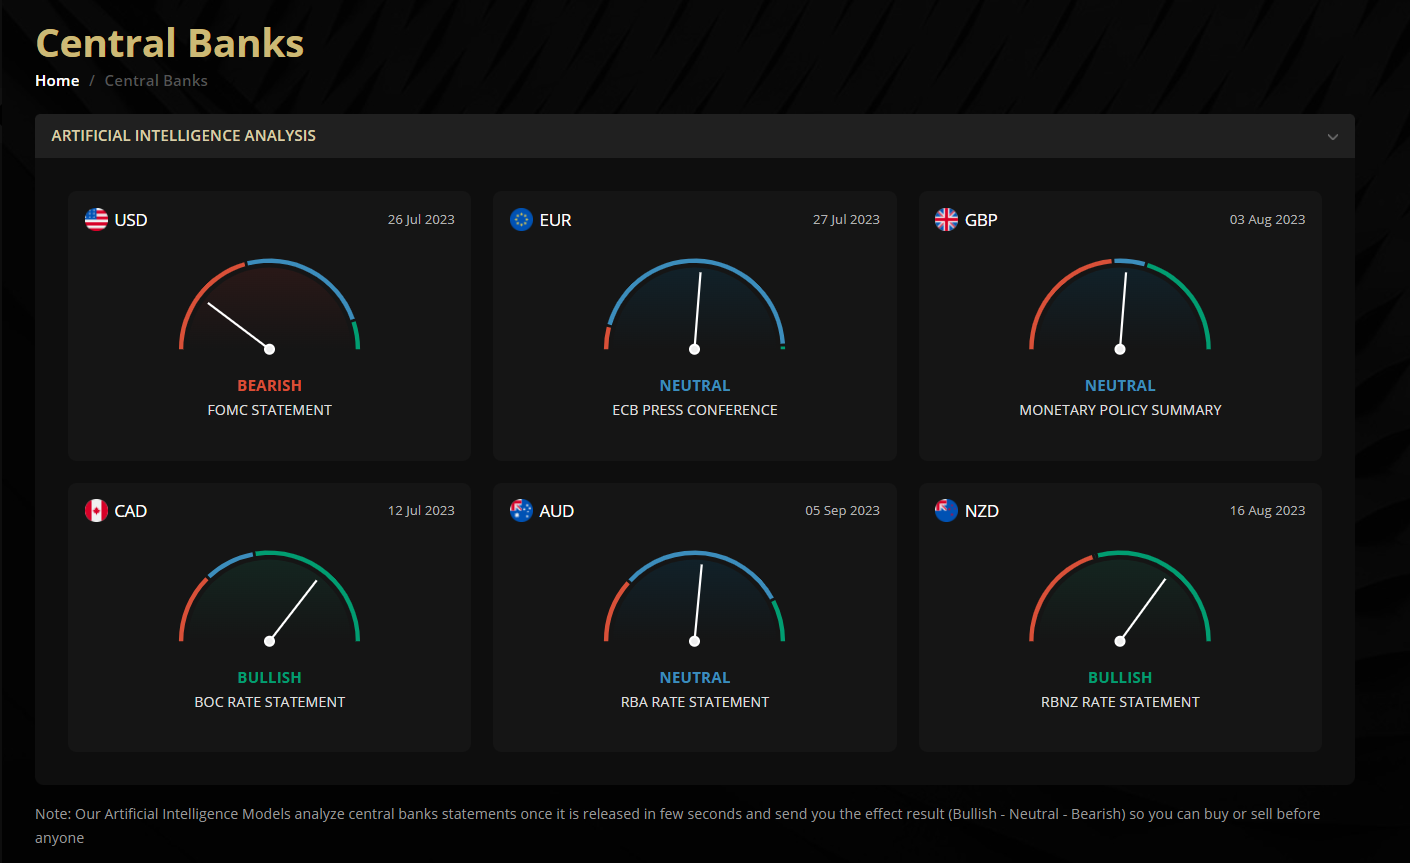
In this page you get instant analysis for central banks statements once they are released.
The Artificial Intelligence analyze central banks statements within seconds and send you the result (Bullish – Neutral – Bearish)
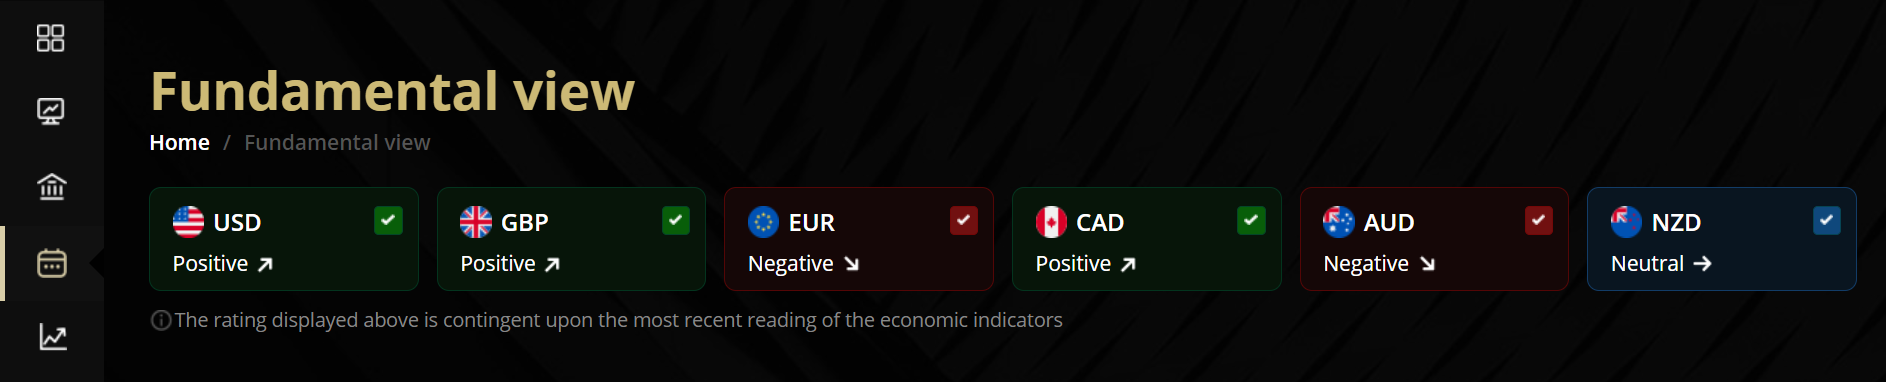
In this page you can find the fundamental analysis for currencies and the AI economic calendar that has more advanced tools like the expected move for each currency for the most important indicators.
In this Example the fundamentals of the US Economy is positive and the fundamental of the Euro area economy is negative so it supports buying EURUSD from the fundamental point of view.
Please note that this rating changes according to the economic indicators releases.
Trading the news became easier with ChartDepth!
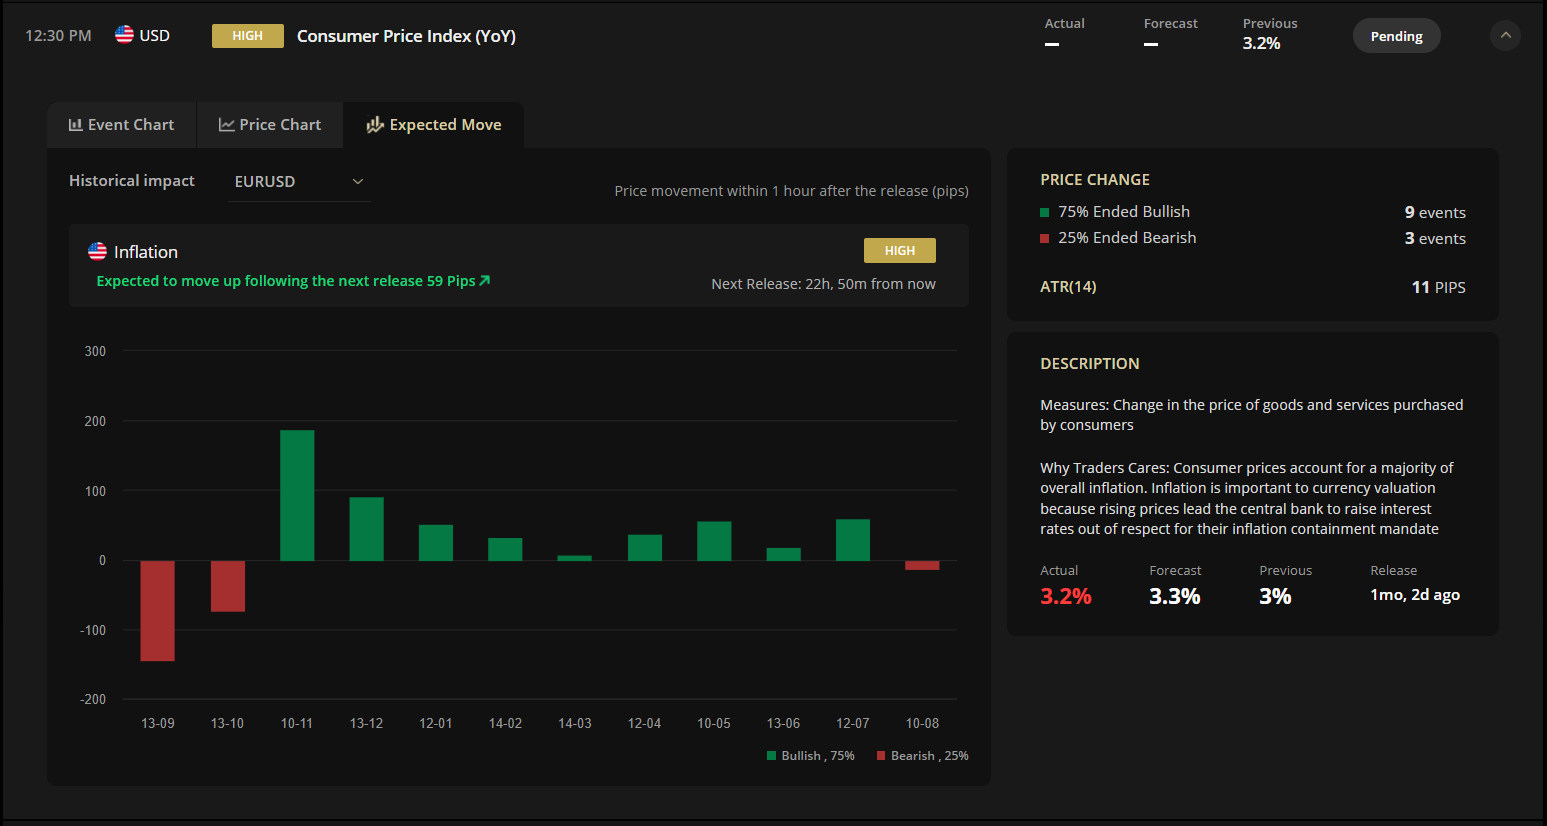
you can get ready for the most important news by placing a Buy or Sell stop according to the (Expected Move) tab so in this example you can place a Buy stop order On EURUSD one minute before the indicator release time, The take profit pips shall be +59 pips and stop loss pips shall be -59 pips.
The expected move here is valid for one hour after the data release.
Price change: shows how many time the pair ended its move one hour after the release on the bullish or bearish side, so in this example the EURUSD ended 75% of times in the Bullish rane and 25% of times ended in the bearish range.
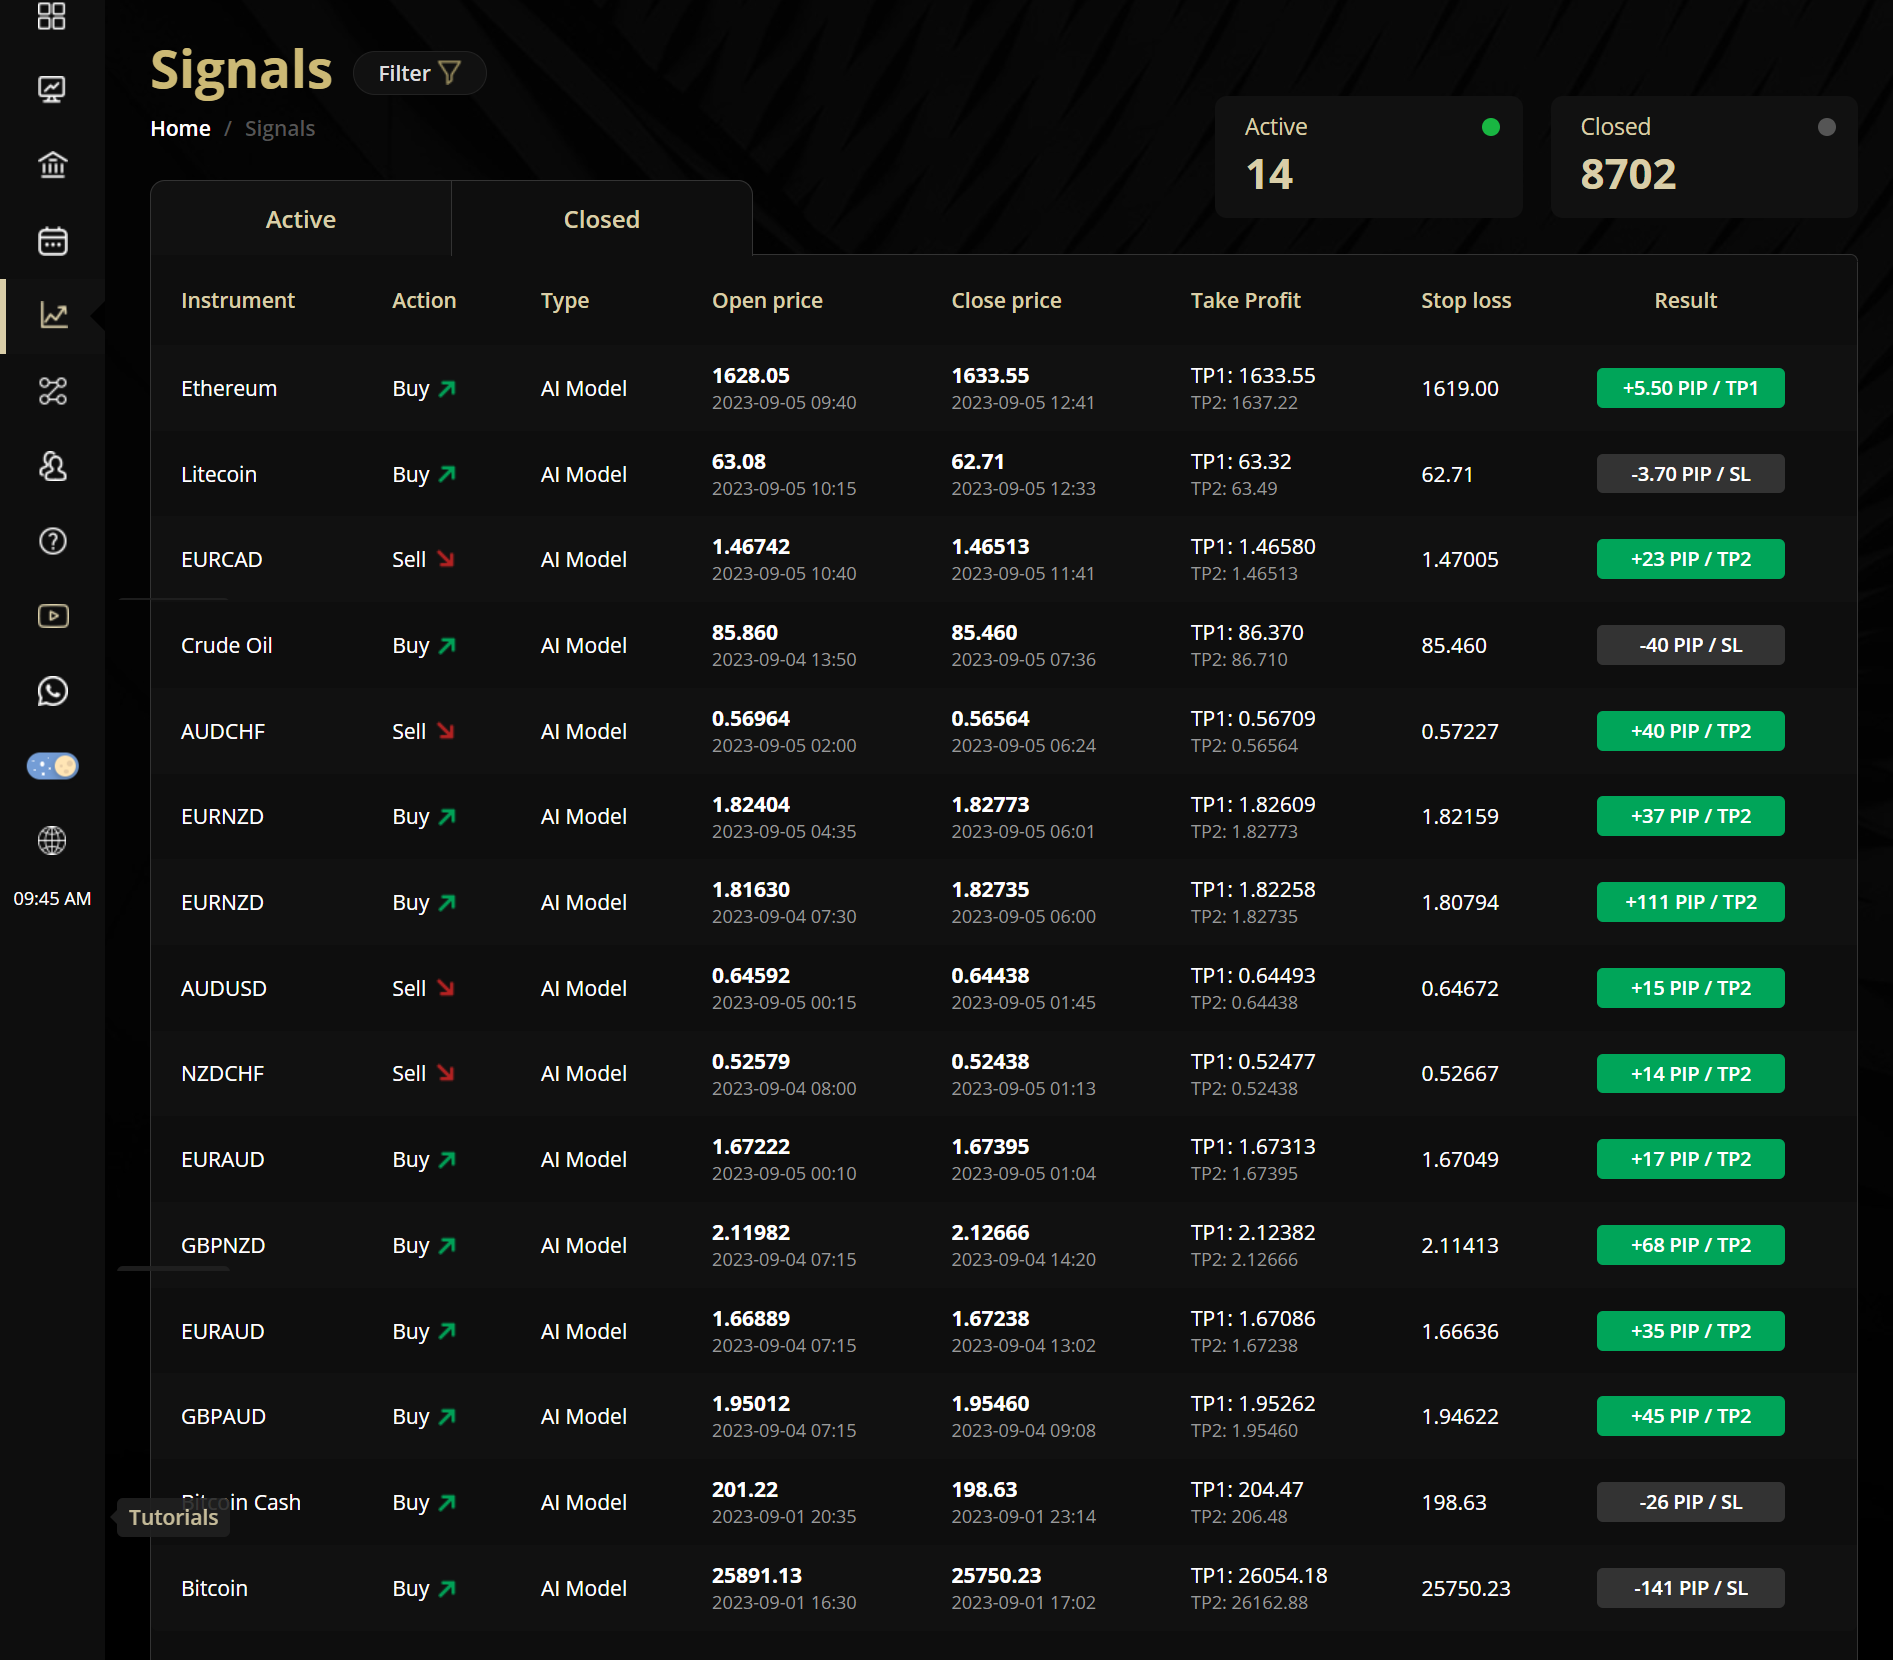
In this page you can find all the available signals on all trading tools which is derived from Artificial Intelliegence models and Big Banks like Goldman Sachs, JP Morgan, Credit Suisse,... etc. and exeprts and you can check the signal source from the signal type. You can check Active signals if you are a premium user, and you can check the closed signals to see the recent performance.
The table shows you all the available signals on all trading tools on multi time frames this includes open price, stop loss levels and take profit 1, take profit 2 and the progress bar which shows you how close is the price from the take profit or stop loss levels.
Once you click the signals you will be able to see all the details of the signals like entry price and how many stop loss pips and take profit pips you can also see these levels on a live chart.
Example : Buy GBPNZD
Here's a trading strategy based on the signals received from ChartDepth, incorporating risk management and adjusting positions based on different levels of Take Profit (TP) notifications:
-
Signal Notification Entry:
- Upon receiving a signal notification from ChartDepth, execute the trade according to the signal's direction (buy/sell).
-
Stop Loss Placement:
- Determine and place your stop loss based on the predefined stop loss level suggested by ChartDepth. This level should align with your predetermined risk per trade.
-
Target Placement - TP2:
- Set your primary target (Take Profit 2 - TP2) based on the TP2 level suggested by ChartDepth.
-
Managing the Position:
-
Option 1: Upon receiving a notification that TP1 is hit:
- Move your stop loss to the entry level to secure profits.
- Close half of your position to lock in profits.
- Allow the remaining half to run towards TP2.
-
Option 2: Upon receiving a notification that TP1 is hit:
- Move your stop loss to the entry level for the entire position.
- Allow the entire position to run towards TP2 without adjusting the stop loss further.
-
-
Risk Management:
-
Prior to entering any trade based on ChartDepth signals, determine your predefined risk per trade. This could be a percentage of your trading capital or a fixed monetary value.
-
Calculate the position size based on the predetermined stop loss level and the overall risk you're willing to take per trade. Ensure that if the stop loss is hit, the loss does not exceed your predetermined risk threshold.
-
Remember to monitor the market closely after entering a trade and react promptly to any notifications from ChartDepth to manage your positions accordingly. Additionally, it's essential to review and adjust your risk management parameters periodically to reflect changes in market conditions and account size. Always practice risk management to protect your capital while trading.
In this page you will be able to check all the available patterns on multi time frames these patterns includes price action patterns and harmonic patterns.
ChartDepth offers a cutting-edge technology that harnesses AI models to identify prevalent price action and harmonic patterns across various time frames within the forex markets. This innovative system employs advanced algorithms to swiftly detect and analyze these patterns, providing traders with comprehensive insights and opportunities across different trading horizons.
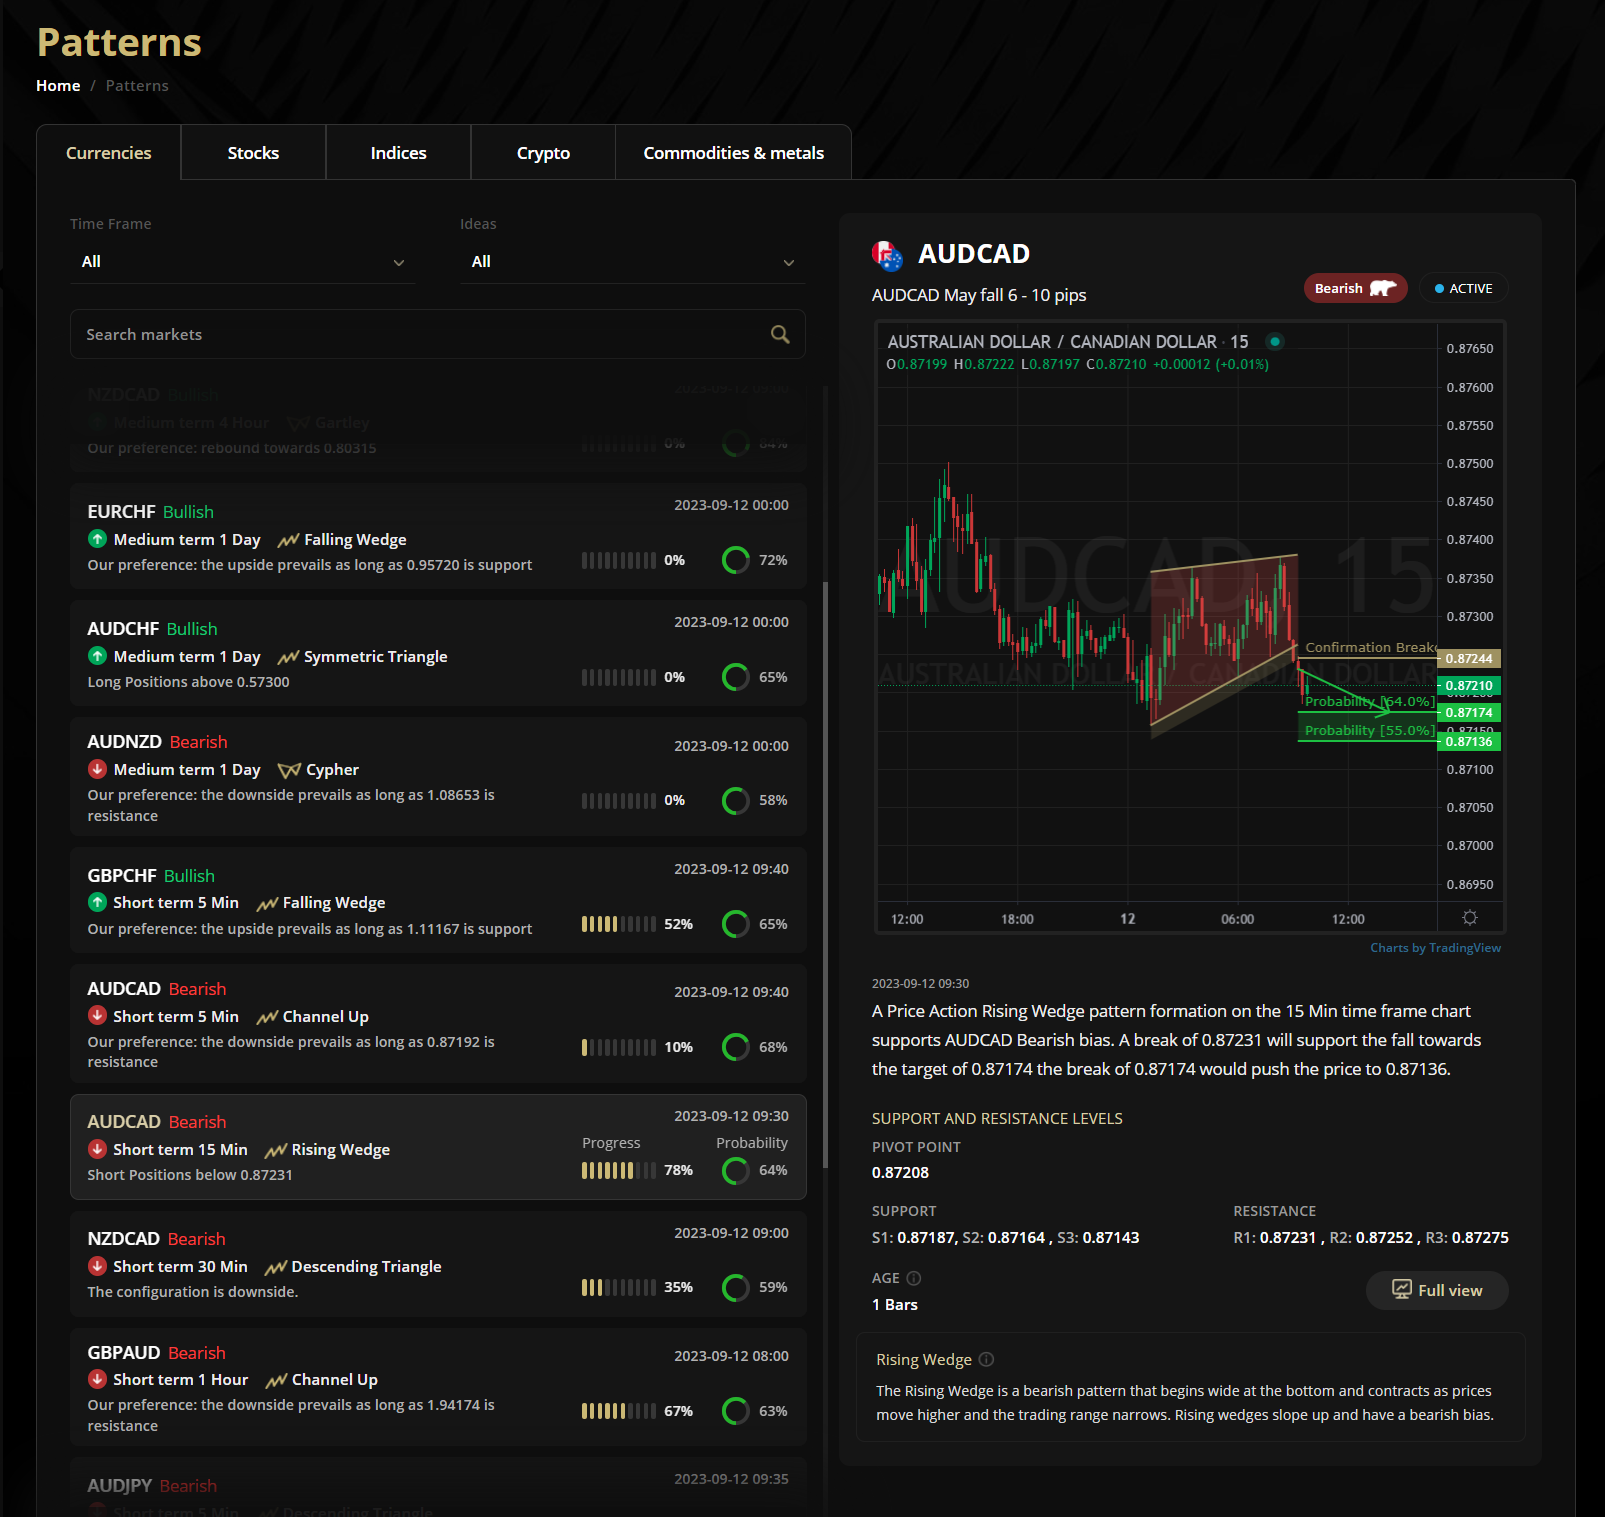
Each pattern has its own details like the conformation price which gives you the opportunity to enter a buy or a sell signal, it also has an accuracy percentage so you can be able to see the success rate of the pattern and “progress” which shows you how many candlestick has been formed since the pattern has been formed.
You can also read a technical commentary for each pattern so you can enter a better trade.
On this page, you can access all the technical patterns for currencies, stocks, indices, cryptocurrencies, commodities, and metals on various timeframes, whether they are price patterns or harmonic patterns.
Each technical pattern contains details that clarify the entry price (confirmation breakout level), which helps you make decisions to buy or sell. You can also view the accuracy of the pattern (success probability), in addition to (age) which refer to the degree of pattern completion, which depends on the number of candles formed since the pattern confirmation.
You can also find pattern details at the bottom of the page, which show the target levels of the pattern, as well as support and resistance levels, and a summary of the formed pattern.
Additionally, you can choose your preferred timeframe to display the available technical patterns on it exclusively.
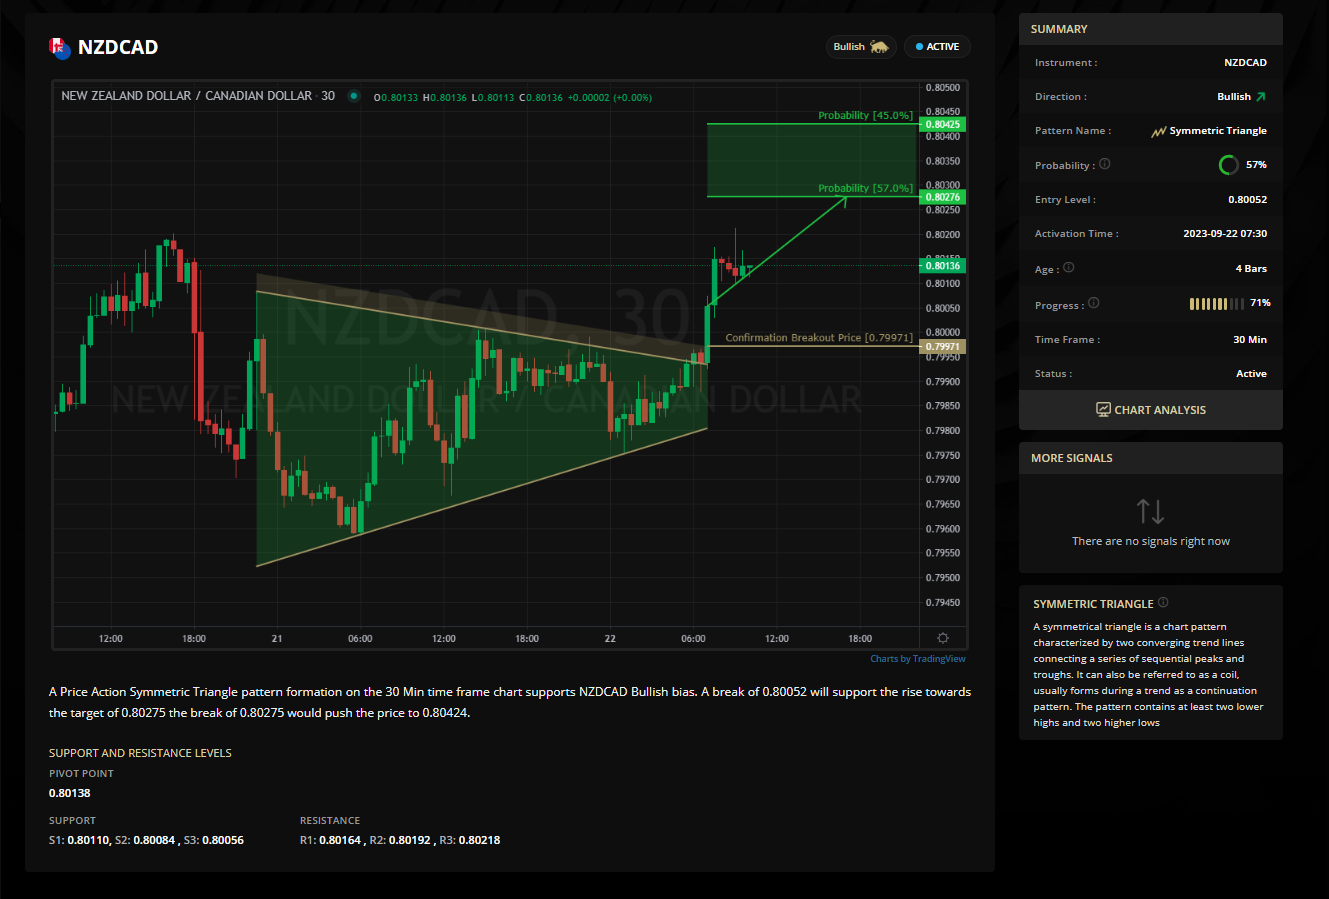
By clicking on (Full View) of the pattern, you will find details about the pattern's formation, such as (Probability), which indicates the success rate of the pattern. (Age) The older the pattern, the more candles have formed since the pattern's creation, and you can check it to see if the pattern is still effective or not from (Progress) If the completion rate is 90%, this means that the pattern is close to achieving its goals, and it is not suitable for buying or selling.
The target levels of the pattern also contain a percentage that indicates the likelihood of the price reaching them, and the closer the percentage is to 100%, the more likely the price is to reach these levels.
You can also check the support and resistance levels at the bottom of the pattern page, which will help you determine stop-loss levels and targets more effectively.
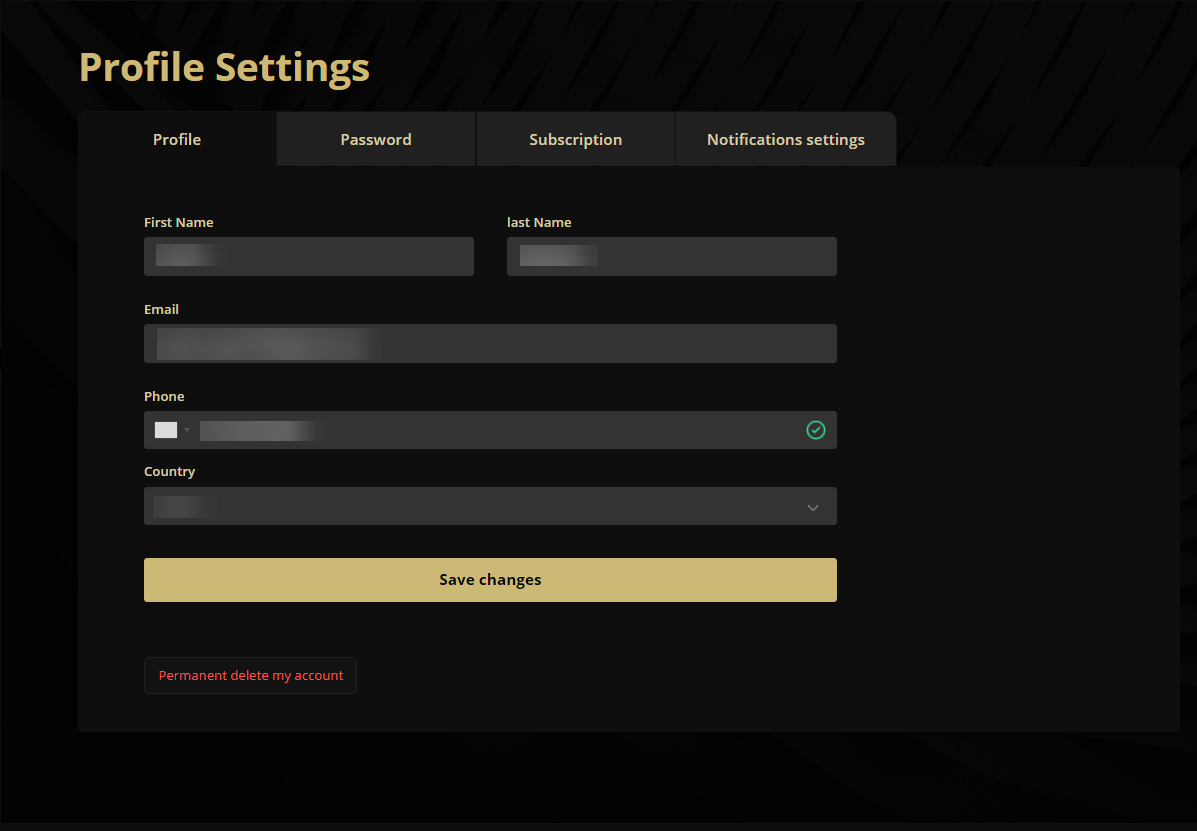
In this page you can control you profile setting whether you want to change your name or password and you can also change or cancel your subscription plan and you can modify your notification settings, so you only get a notification for your preferred trading tool.
you can also chnage your subscription plan or upgrade it to get a discount up to 50% on the annual plan.
ChartDepth Mobile App: Your Gateway to FX Market Signals and Analysis
The ChartDepth mobile app is a user-friendly tool for traders in (FX) trading. Offering a comprehensive solution for staying informed and making data-driven decisions in the FX market, this app stands out as an essential resource for traders of all levels.
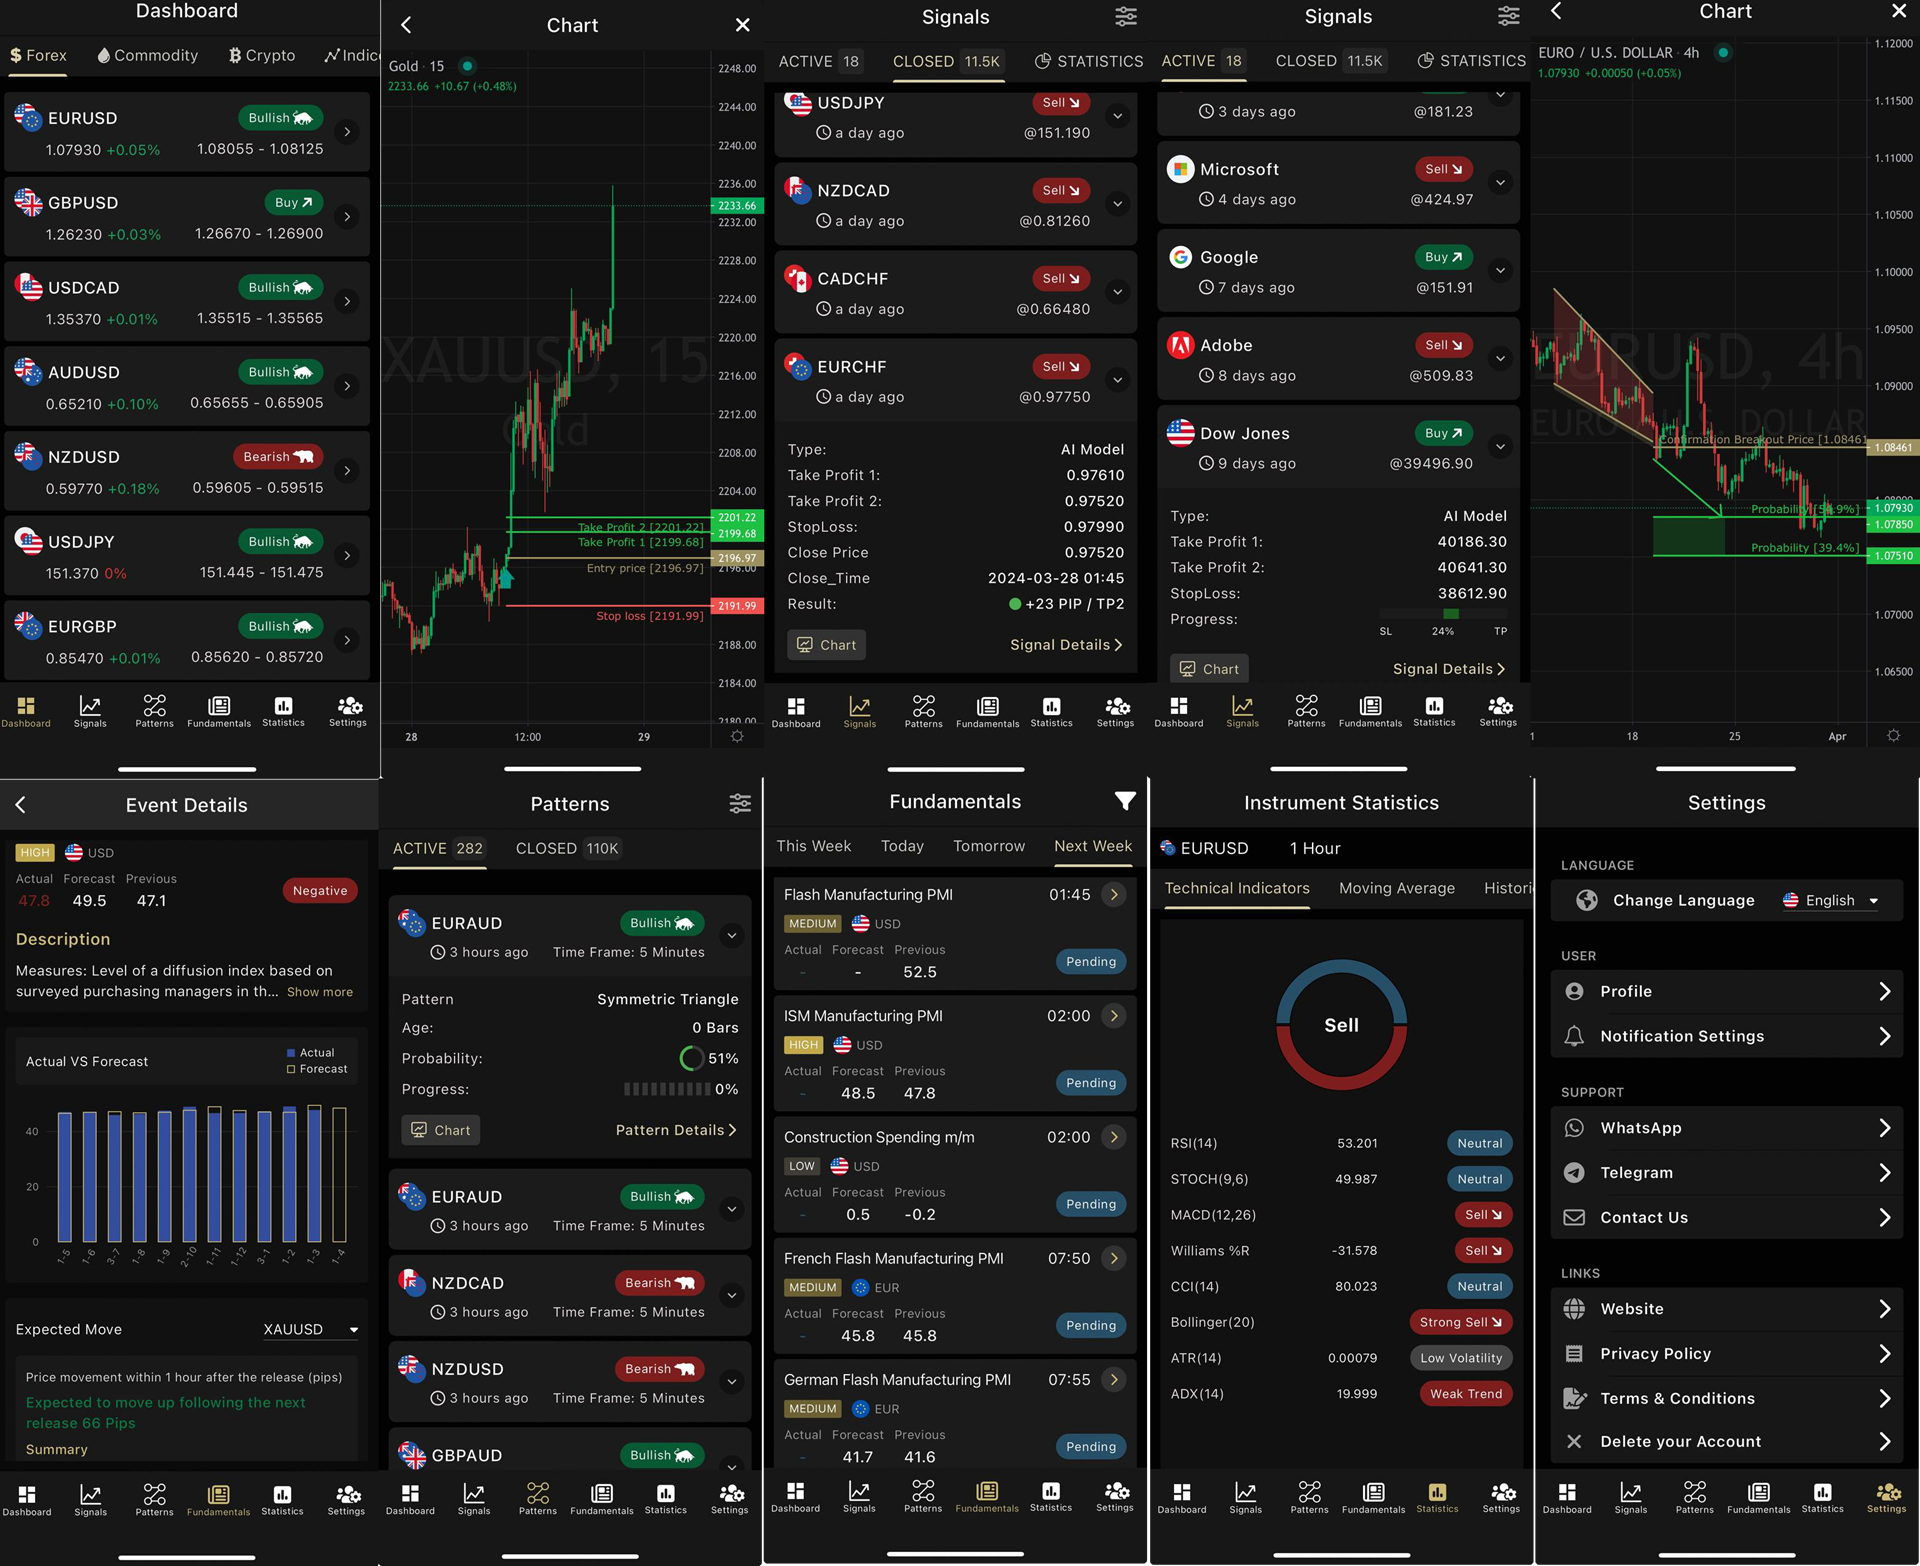
Key Features:
-
Real-Time Notifications: ChartDepth ensures users never miss a critical market development by delivering real-time notifications directly to their mobile devices. These notifications include signals, patterns formation, central banks analysis and other updates, keeping traders constantly informed and enabling them to respond promptly to market shifts. please not that this feautre is only available for premium users.
-
Market Signals: The app provides users with accurate and timely FX market signals generated through advanced technical and fundamental analysis. These signals are curated by artificial intelligence and experts, empowering traders with valuable insights to make informed trading decisions.
-
Comprehensive Analysis: ChartDepth offers in-depth analysis of currency pairs, including historical data, trend analysis, patterns recogntions and various technical indicators. This comprehensive analysis equips traders with the knowledge needed to understand market dynamics and identify potential opportunities.
-
Customizable Alerts: Users can tailor their notification preferences, setting up alerts for specific currency pairs, signal types, or market events. This customization ensures that traders receive only the information most relevant to their trading strategies.
-
User-Friendly Interface: ChartDepth boasts an intuitive and easy-to-navigate interface, making it accessible to both novice and experienced traders. The app's design prioritizes user experience, allowing traders to access critical information effortlessly.
-
Trade The News: Through advanced artificial intelligence algorithms, our Models can now provide insights and predictions on upcoming market indicators releases. These AI-generated forecasts are designed to help you make more informed trading decisions by anticipating market movements ahead of time. so you can be a professional scalper by placing pending orders depending on our moves expectaions.
Download ChartDepth now and experience the future of FX trading at your fingertips.
App Store From (here)
Google Play From (here)
We're excited to offer you an array of subscription plans designed to provide you with full access to ChartDepth's premium services and insights. Whether you're a casual trader or a seasoned pro, there's a plan that suits your needs.
Here are our subscription options:
1. Free 14 Days Trial: There are no payment details required, and you can enjoy all the premium features without any commitment with only a limited access to signals page, after the trial period ends and you like to prefer to continue using chartdepth services you can choose to subscribe to one of the available packages.
2. Monthly Plan - $49/month: Enjoy the flexibility of our Monthly Plan, giving you access to ChartDepth's premium services for a month at just $49.
3. 3-Month Plan - $99 for 3 months: Get more value with our 3-Month Plan, offering uninterrupted access to ChartDepth for three months at a discounted rate of $99 (-30% Off)
4. Annual Plan - $360 for 1 year: For our committed users, the Annual Plan provides a full year of premium access at an incredible price of $360. That's a substantial saving with a discount up to 40% Off.
You can subscribe from here
How to get a Free Premium access to our services?
We have fantastic news for you! Now, you can also enjoy premium access to our extensive suite of services by simply holding a live funded trading account with one of our trusted partners through the provided links.
Here's how it works:
-
Live Funded Trading Account: Open and fund a live trading account with one of our partner brokers using the unique links provided by ChartDepth (open an account with OW Markets and get the service for free)
-
Unlock Premium Services: With your live funded trading account, you will gain full access to ChartDepth's premium services, including in-depth market analysis tools, real-time insights, and a wealth of resources to empower your trading strategies.
Since you are here we would like to offer you a gift! use promo code UDEMY10 at the checkout payment page to get 80% Discount on the first month!
ChartDepth Premium Account Features.
1- Daily live signals derived from AI models and big banks on multi time frames with instant notifications on your mobile or browser
2- Price action and harmonic patterns recognition with instant notifications
3 - central banks statements analysis within seconds using AI models
4- Advanced economic calendar with expected price range for important indicators
5- Statistical performance for expected price range each month
6- Advanced charting tools
7- Instant notifications
Feel the power of Artificial Intelligence in trading with ChartDepth and achieve more than +2000 pips each month!
To subscribe or upgrade your current plan, simply log in to your ChartDepth account and visit the profile setting page. Select the plan that suits you best, and you'll be on your way to enjoying the full benefits of ChartDepth's premium services.
We're here to help you make informed trading decisions and succeed in your financial endeavors. If you have any questions or need assistance with your subscription, please don't hesitate to reach out to our dedicated customer support team at [email protected] or get in touch through what's app.
Partnering with ChartDepth: Enrich Your Brokerage Services
At ChartDepth, we prioritize collaboration and believe in empowering brokerage firms to enhance their services. If your brokerage seeks to provide comprehensive and innovative trading solutions to your clients, partnering with ChartDepth can elevate your offerings to a new level.
Why Partner with ChartDepth?
Access to Premium Services: Through our partnership, your clients gain access to premium services offered by ChartDepth, including real-time market analysis, Daily signals with 85% accuracy, AI-driven insights, customized alerts, Economic data, fundamental& Technical analysis and comprehensive charting tools.
Innovative AI Technology: Our AI technology identifies and analyzes market trends, offering your clients the advantage of timely and accurate data on price action and harmonic patterns across multiple time frames in the forex market.
Enhanced Trading Experience: Elevate your clients' trading experience by integrating ChartDepth's state-of-the-art technology, providing them with invaluable tools and resources to make informed decisions in their trading endeavors.
Our Partnership Offerings:
Tailored Solutions: We understand that each brokerage firm has unique requirements. ChartDepth offers customizable solutions tailored to align with your brokerage's specific needs and preferences.
Dedicated Support: Our team provides dedicated support to streamline the integration process, ensuring a seamless and efficient partnership experience for your brokerage and its clients.
Comprehensive Training: We offer comprehensive training sessions and resources to acquaint your team with our platform, enabling them to assist clients effectively and make the most of our services.
Join Us in Empowering Traders:
Partnering with ChartDepth is a step toward empowering your clients with advanced analytical tools and valuable insights, enabling them to navigate the dynamic forex markets more effectively. Our collaboration will not only enrich your brokerage services but also elevate your clients' trading experiences.
Take the next step in enhancing your brokerage services by partnering with ChartDepth. Contact us today to explore this exciting collaboration opportunity and revolutionize the way your clients trade.
For partnership inquiries or further details, please reach out to [chartdepth support].
Real-time notifications in the ChartDepth app are among the most powerful tools that help traders avoid missing opportunities in the financial markets. By enabling notifications, you will receive trading signals, pattern formation alerts, and central bank analysis instantly on your mobile phone.
Below are the steps to activate notifications on both iOS (iPhone) and Android devices:
-
Open the Settings app on your device.
-
Tap on Notifications.
-
Scroll down and find ChartDepth, then tap on it.
-
Enable Allow Notifications.
-
Make sure the following options are also turned on:
-
Show on Lock Screen
-
Sounds
-
Badges
-
After completing these steps, open the ChartDepth app and ensure you are logged in and have enabled notifications from within the app as well.
-
Open the Settings app on your phone.
-
Select Apps, then search for and select ChartDepth.
-
Tap on Notifications.
-
Enable Allow Notifications.
-
Make sure all relevant types of notifications are enabled (e.g., push notifications, in-app alerts, etc.).
Don't forget to open the ChartDepth app and verify that notifications are enabled from within the app settings.
-
Make sure the app is allowed to run in the background.
-
Do not enable Do Not Disturb mode during trading hours.
-
Check that your internet connection is stable.
upgrade to premium
Upgrade to premium and Enjoy the Full Power of Chartdepth Advanced Tools.
Enable notifications to receive markets updates including signals, analysis, patterns and more!
You can disable notifications at any time from your browser
Please allow your notifications from your browser settings
© 2026 ChartDepth. All Rights Reserved.